After successfully securing JGI seedcorn funding (January 2025) we set out to explore how everyday data—specifically supermarket loyalty card data—can be transformed into meaningful insights for public engagement.
Developed by lab member Dr. Laura Fryer and Jean Golding Institute (JGI) data scientist Dr. Huw Day, the project developed a prototype data visualisation tool that helps individuals better understand their shopping habits and the broader potential of digital footprint data for public good.
Initial Idea
This project grew from a collaboration with We The Curious science centre in Bristol, where an interactive exhibit sparked public conversations about data donation and its potential for good.
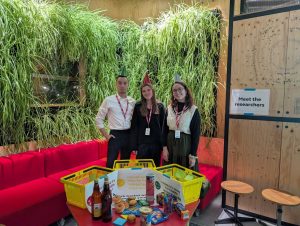
Initial discussions at a ‘Meet the research event’ revealed most people didn’t know they could access their data but many were curious about how their shopping habits could support public health research. We needed a tool to be able to bridge the communication gap and show people the value of this data.
What’s in the Data?
Thanks to the implementation in the UK of the right to data portability, individuals can request their personal data from companies like Tesco, which details when they have scanned their Loyalty Card whilst shopping. The data includes information such as:
- Every item purchased using a Clubcard (online or in-store)
- Metadata like quantity, date, time, and payment method
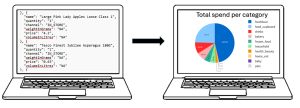
- Delivered in a raw .JSON format— which is difficult to interpret without technical skills
Prototype in Action
There was ongoing development of a Python-based visualisation tool that aggregates this data. It turns one long lists of thousands of products into interactive dashboards showing spending patterns over time, product categories by volume and cost and price changes of frequently bought items.
The prototype was tested during:
- A public panel with 10 participants, including a “Data Hazards” session
- An interactive workshop with 20 data experts at the Digital Footprints Conference 2025 in Leeds
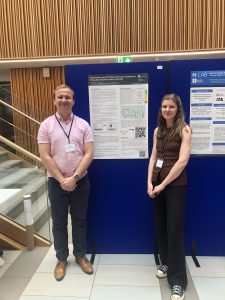
- A poster presentation showcasing the tool’s capabilities with live demo
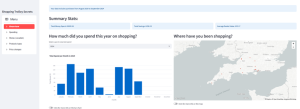
The landing page of the application, showcasing an overview of the type of outputs that can be aggregated from Tesco Clubcard data.
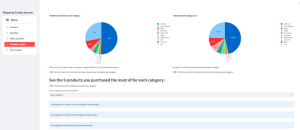
This shows the ‘Categories’ tab on the application. We chose to include monetary and volume of product categories, as well as a word drop-down menu.
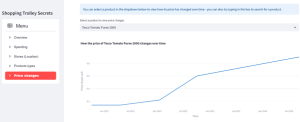
This shows a section of the ‘price changes’ tab of the application. There is an option to show the changes in price of items that have been purchased over time.
What’s Next?
Although the seedcorn funding is wrapping up, the journey isn’t over. We received great feedback from the initial launch which we plan to implement into a second version of the application. The next phase should also see the tool be launched more widely, and eventually be made publicly available, so anyone can upload and explore their own data.
Stay tuned to the blog and lab socials for more updates!
Huge thanks to the Jean Golding Institute at the University of Bristol for supporting this project.